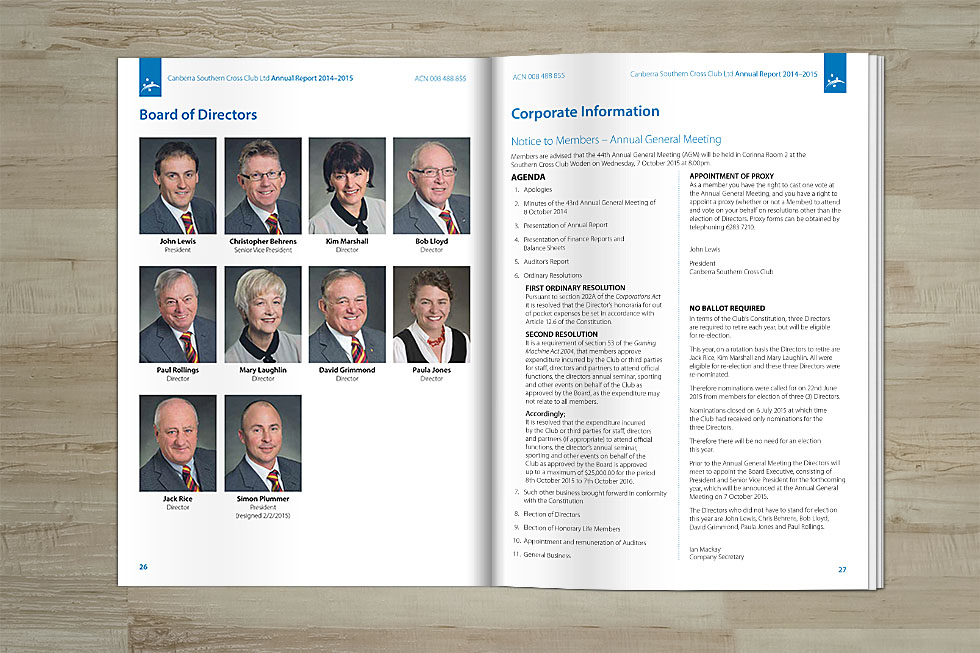
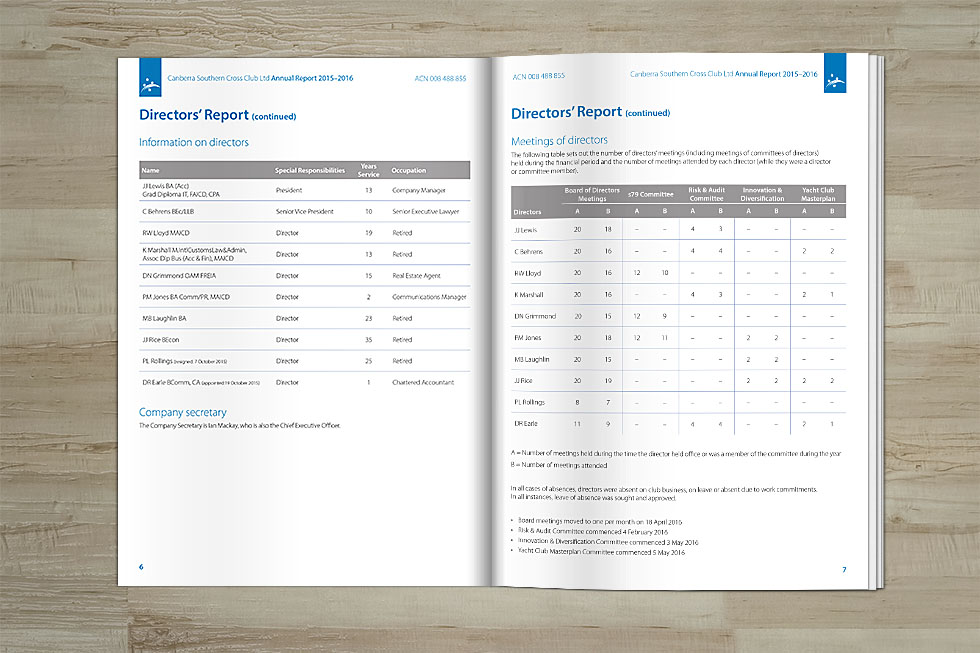
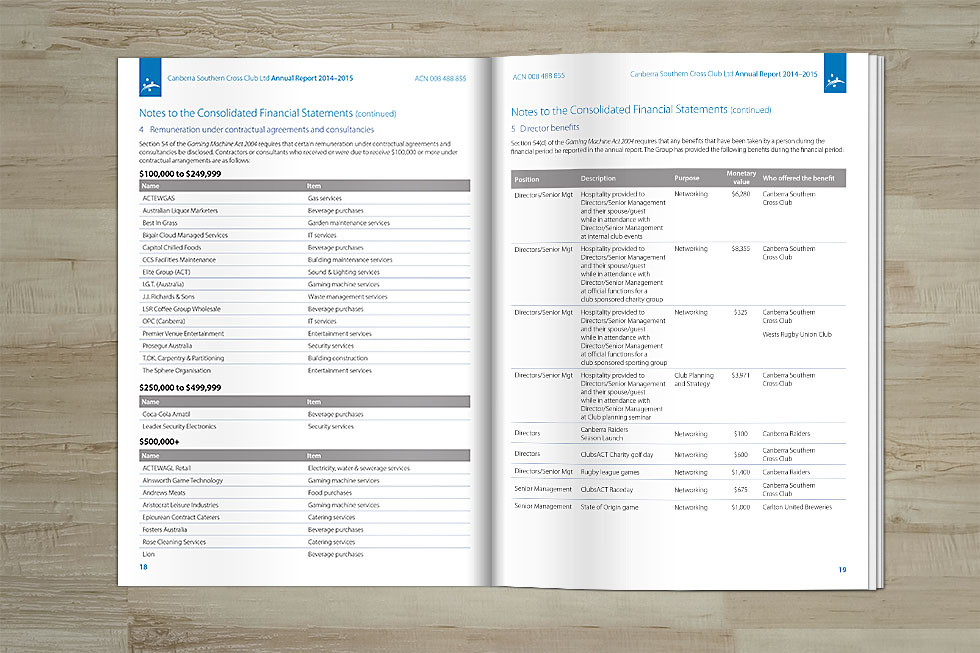
Annual Reports designed by Jen Leheny for Canberra Southern Cross Club
![](https://cdn.myportfolio.com/e9e89c4048dca1038c87ff514f488645/7ff2aa13-ecd3-47e2-8aac-c57d161c2477_rw_1920.jpg?h=cfc5d76c5a6badefcd24ef206ce9125d)
![](https://cdn.myportfolio.com/e9e89c4048dca1038c87ff514f488645/2c3b9696-29bd-484c-b8b1-a58a0db22b4a_rw_1920.jpg?h=b0fbb18d9be51314357a71369ec10ef6)
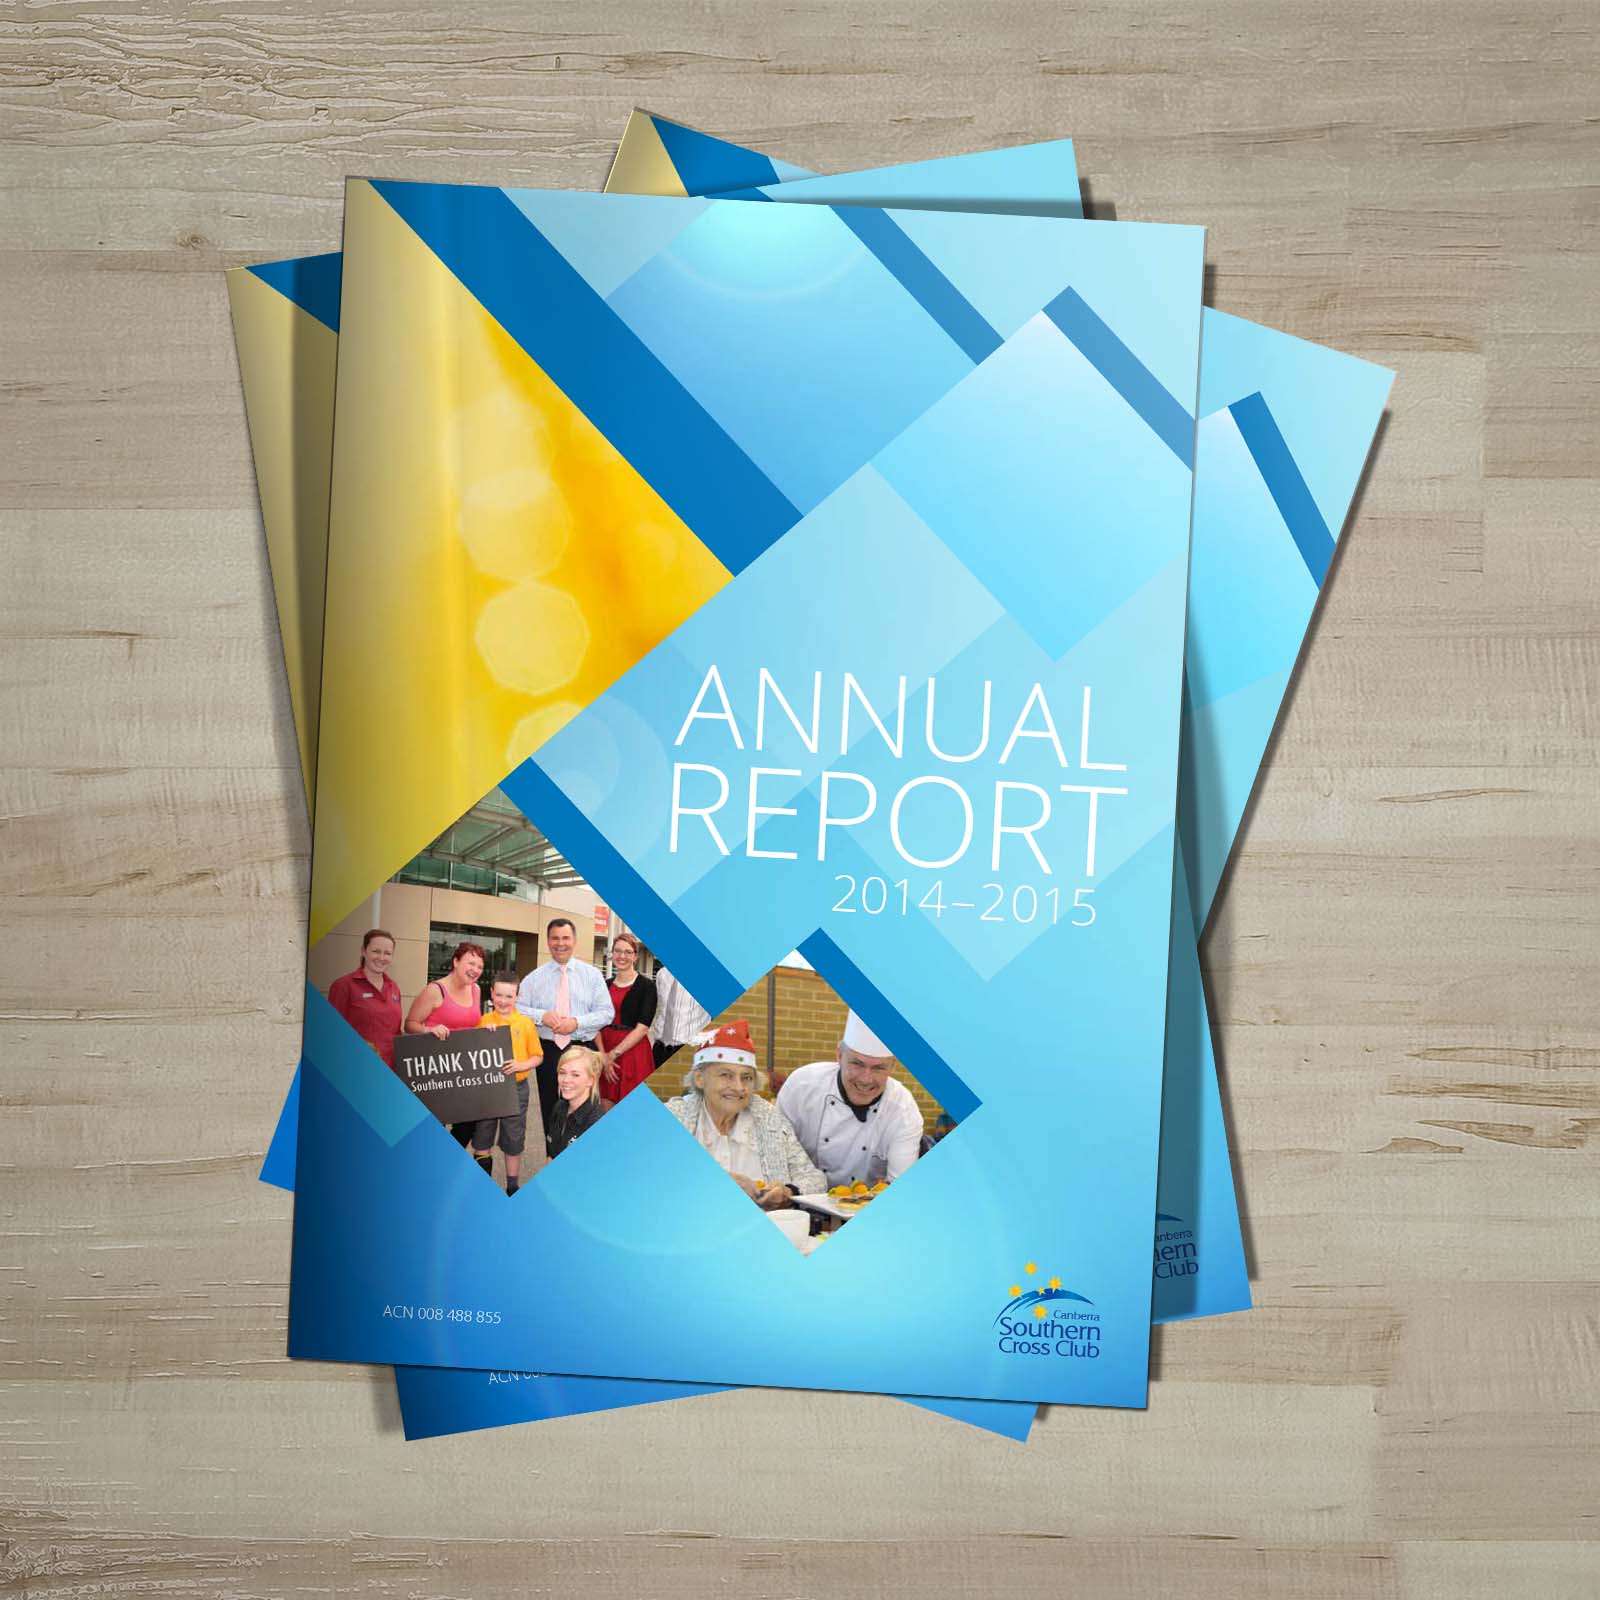
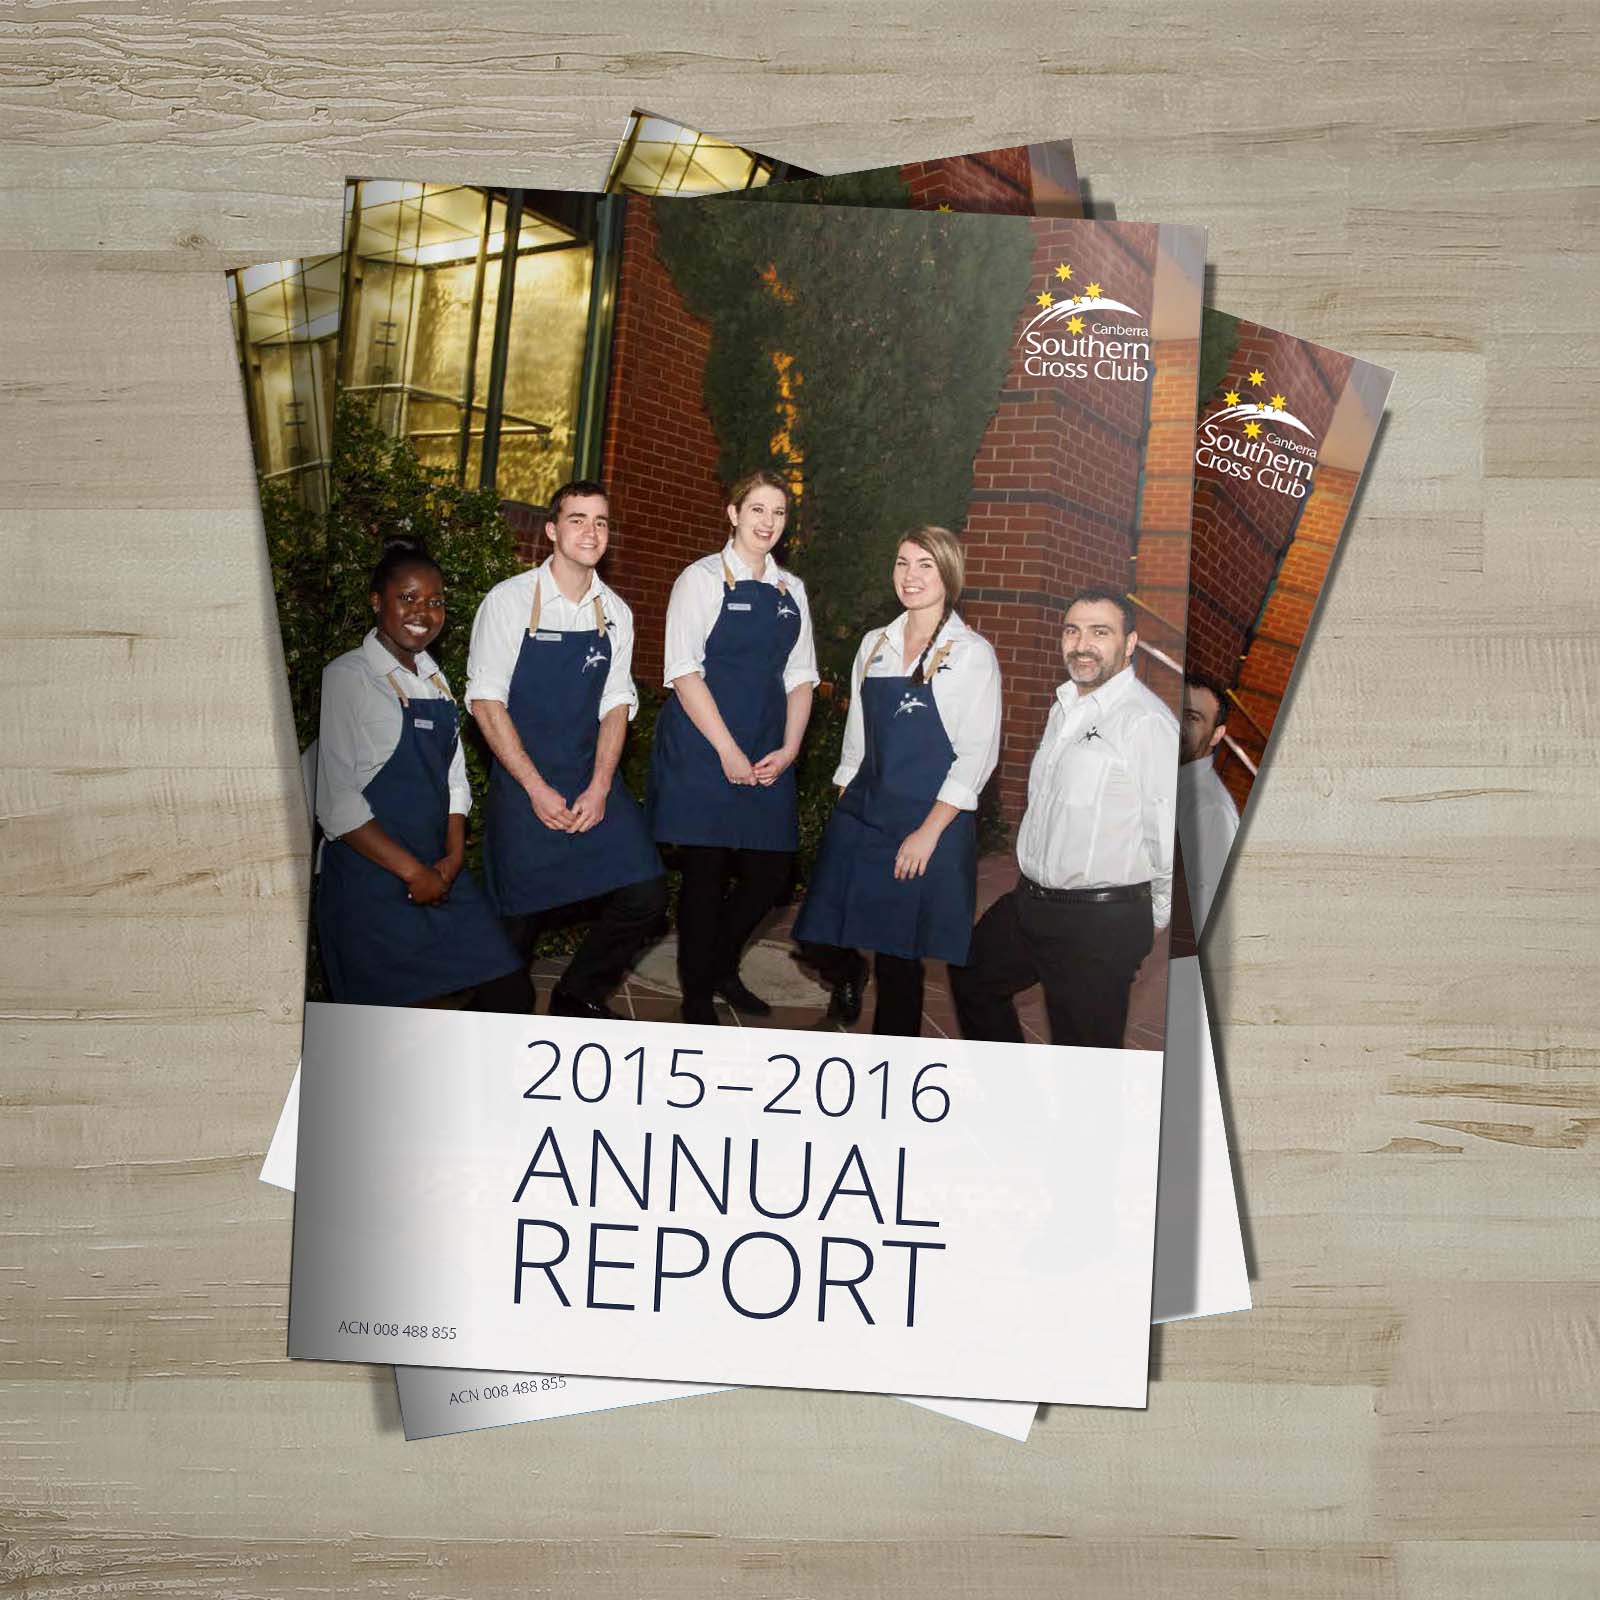
Some pages from the Canberra Southern Cross Club's 2014-15 and 2015-16 Annual Reports
![](https://cdn.myportfolio.com/e9e89c4048dca1038c87ff514f488645/7836be16-2353-4bf4-9756-0d577df6cefa_rw_1200.jpg?h=590f1b0b90a14d5f8b430410ae59ad24)
![](https://cdn.myportfolio.com/e9e89c4048dca1038c87ff514f488645/462ad4a6-c004-4e52-b6b7-5d80a688783f_rw_1200.jpg?h=d6da5fdab599fe0265c0e395ee2739ec)
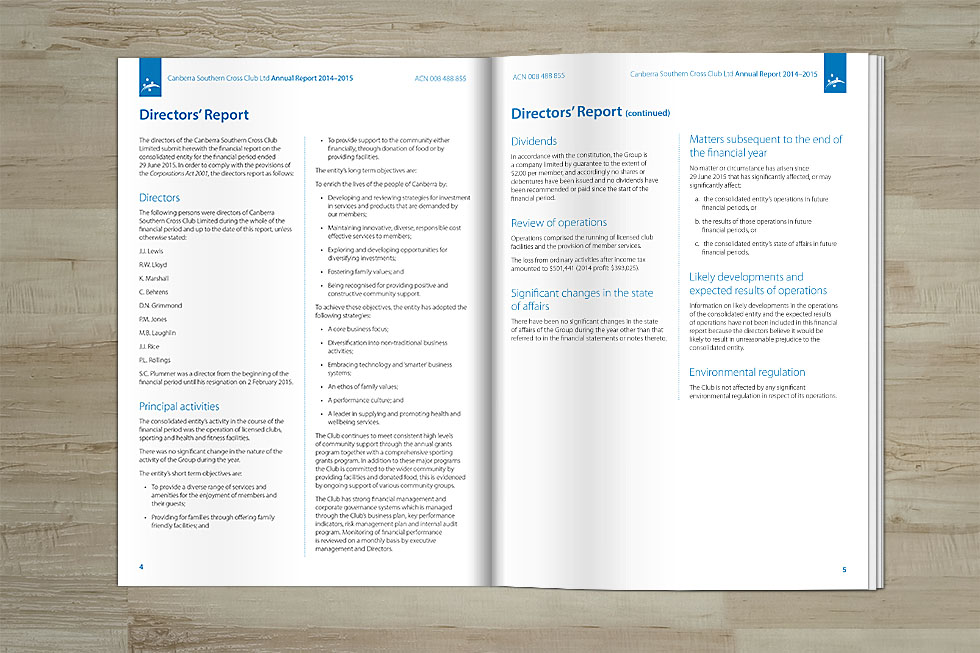
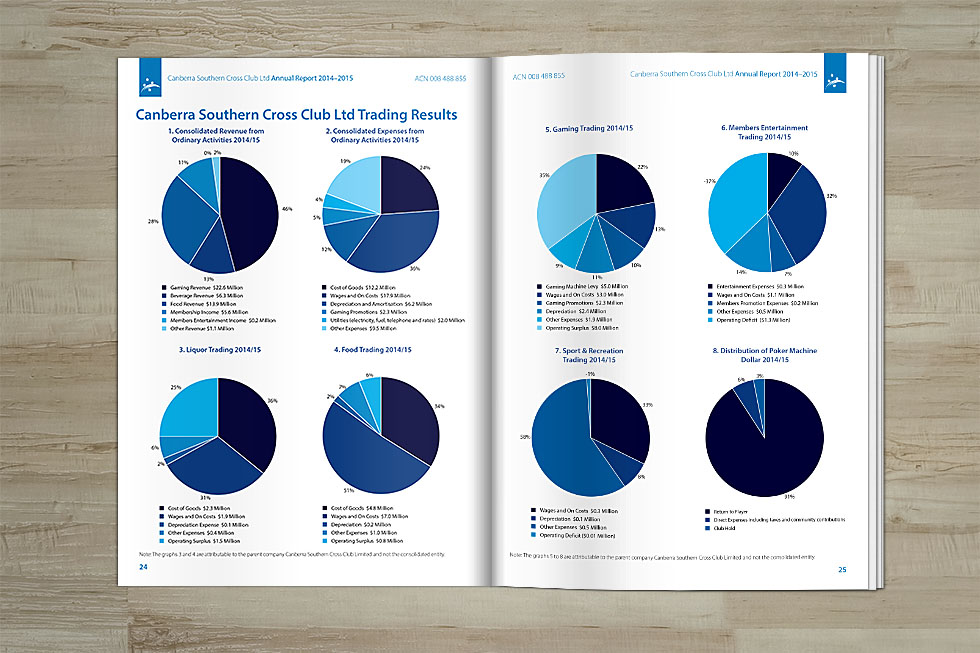
Tables were used within InDesign to display the complex information in an easily read way.
![](https://cdn.myportfolio.com/e9e89c4048dca1038c87ff514f488645/5a216798-6f32-4082-a490-4e8117c679aa_rw_1200.jpg?h=e276b4cc0e749a305cd5708681157831)
Information for the graphs was provided in Excel sheets and I turned these into pie charts using Illustrator's graphing functions, keeping the colour palette simple with shades of blue.
![](https://cdn.myportfolio.com/e9e89c4048dca1038c87ff514f488645/bc373c4b-0151-4602-a4d2-1785a68885f8_rw_1200.jpg?h=f345ed326dfa5d0ef45886fbd3e5962d)
![](https://cdn.myportfolio.com/e9e89c4048dca1038c87ff514f488645/3c20987b-868e-4f40-b34e-be76abd4d1b0_rw_1200.jpg?h=d5d3cc77dd365690c359e3def18f6343)