Infographic - personal project
Designer Jen Leheny
![](https://cdn.myportfolio.com/e9e89c4048dca1038c87ff514f488645/84798551-9187-409a-86d8-849402285614_rw_1200.jpg?h=4190e1f780af87880383a002d8786e4e)
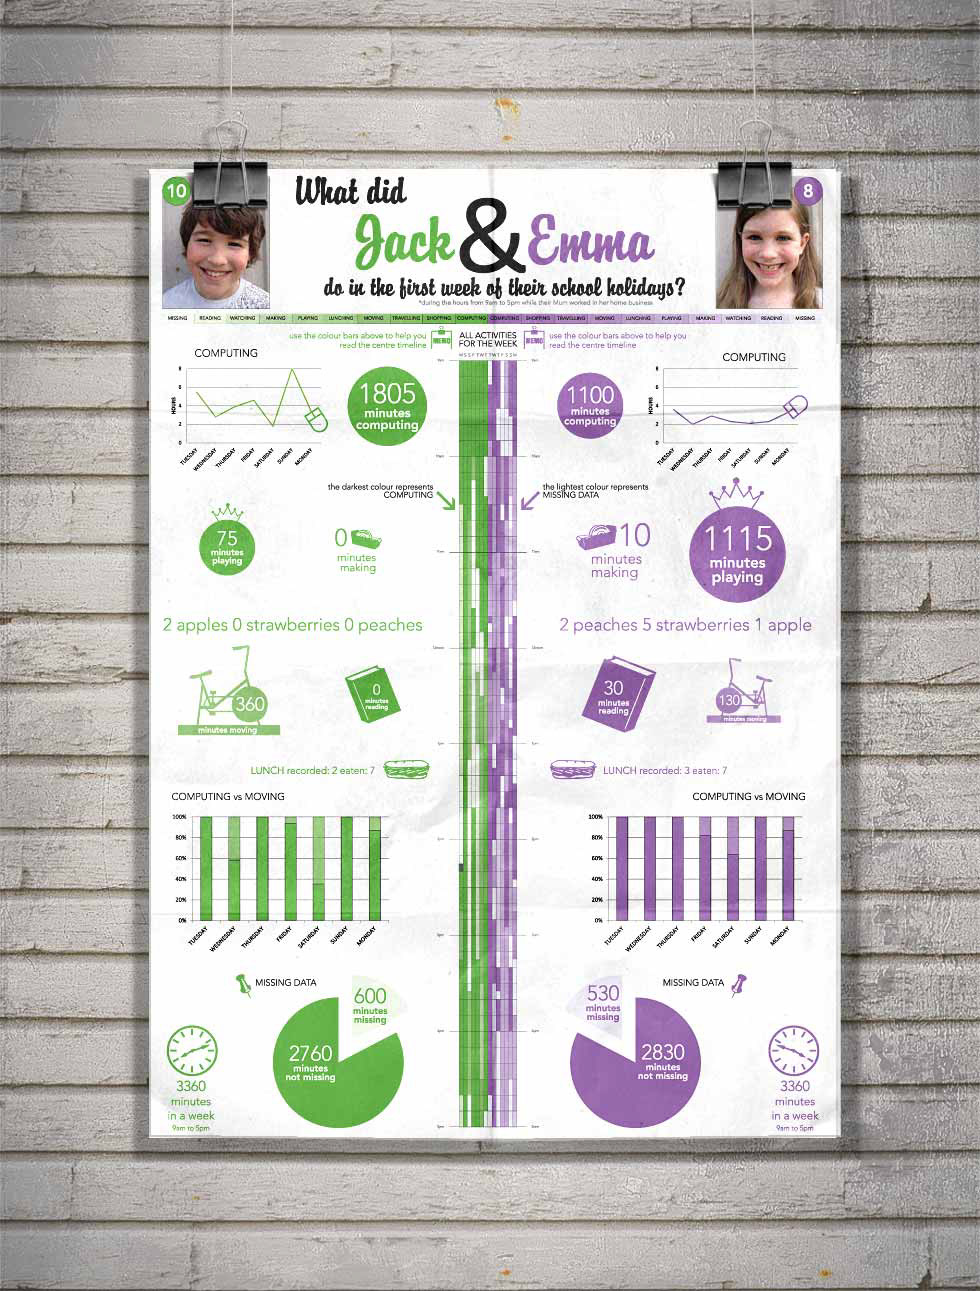
I got my kids (8 and 10 at the time) to keep a record of their activities during the first week of school holidays, then used infographic techniques to form a visual representation of the data.
![](https://cdn.myportfolio.com/e9e89c4048dca1038c87ff514f488645/f08bc761-166a-42cd-9f1a-4ffc5a494a6a_rw_1200.jpg?h=ce1f584ee008d94fcbcfe2060a3333a6)
How we gathered the data, below left and centre. Concept sketch below right, done during planning stages.
![](https://cdn.myportfolio.com/e9e89c4048dca1038c87ff514f488645/e7d79931-048b-4a3b-a0fa-dd21390fa74d_rw_1920.gif?h=dd647b0bf3ae29d28079bf3c5f352170)
![](https://cdn.myportfolio.com/e9e89c4048dca1038c87ff514f488645/913c4282-e3d3-4796-802c-fca58fa9ff78_rw_1200.gif?h=ecc0fcf91fe28bfafb5e1273ed3bfae3)
![](https://cdn.myportfolio.com/e9e89c4048dca1038c87ff514f488645/949aa07a-18c6-4f7a-ae84-df57d02e4a3f_rw_1200.gif?h=b11f3bba2dceb422d22fe99285010478)